A recent study by Lytx Inc. reveals that major metropolitan areas, particularly those near airports, are among the riskiest places to drive in the United States. The study, presented in Lytx’s fifth annual “State of the Data” report for trucks and vehicle fleets, utilized the Lytx Driver Safety Program and analyzed over 36 billion miles of new driving data (with a total of over 221 billion miles captured through Lytx’s DriveCam Event Recorders). Interestingly, despite an increase in the number of miles driven, the study indicates a decrease in overall risky driving behavior. The report also sheds light on the specific times of day and night when collisions are more likely to occur.
In terms of the riskiest driving cities in 2021, several familiar names maintained their positions in the top five rankings. However, there were a few notable changes. Atlanta managed to improve its standing and moved up to the seventh spot, while Dallas/Fort Worth entered the top five for the first time. On the other hand, New York retained its position as the number one city for risky driving for the second consecutive year.
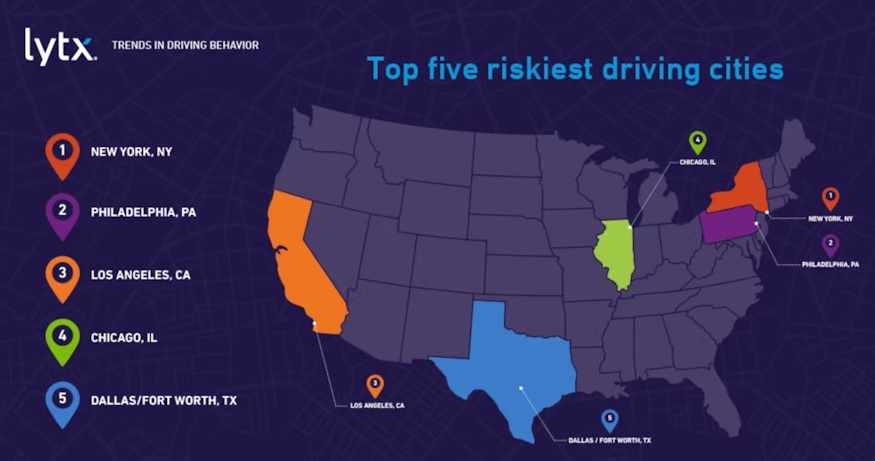
Top five riskiest driving cities:
- New York
- Philadelphia
- Los Angeles
- Chicago
- Dallas/Fort Worth
In 2021, several cities known for their risky driving continued to hold their positions in the top five rankings. However, there were notable changes as well. Atlanta showed improvement and moved up to the seventh position, while Dallas/Fort Worth made its way into the top five for the first time. Meanwhile, New York maintained its status as the number one city with the highest level of risky driving for the second consecutive year.
Top five riskiest public roadways include:
- Michigan (I-94 at Merriman Road, Romulus) A complex airport interchange
- New York (George Washington Bridge near Riverside Drive, NY) The world’s busiest vehicular bridge
- California (Edom Hill Road and Varner Road, Desert Hot Springs) A lack of lane markings
- New Jersey (NJ19 and I-80 in Paterson) A complex interchange, with highways terminating into city streets
- Connecticut (I-95 near Fulton Terrace, New Haven) A curved freeway entering the busy port of New Haven
In 2022, airports have become increasingly identified as some of the most hazardous driving areas in the United States. Startlingly, 14 out of the top 30 sections of public and private roadways with the highest risk were located within a two-mile radius of airports. This figure represents an 86% increase compared to the previous year, 2021, when eight of the top 30 riskiest roadways were situated near airports. These statistics highlight the growing concern and heightened dangers associated with driving in close proximity to airports.
The top five high-risk airports to drive around include:
- Denver International
- John Glenn Columbus International
- Phoenix Sky Harbor
- John F. Kennedy International
- Newark Liberty International
“Airports likely stand out as having among the more dangerous roadways due to several factors, including the high number of intersections and transitions, the high percentage of drivers unfamiliar with the routes, the high concentration of cars, and of course, hurried or distracted behaviors such as looking at mobile phones,” said Kyle Warlick, Senior Client Intelligence Analyst at Lytx.
The time of day also impacts the likelihood of a collision. The survey found:
- In 2022, the highest total number of collisions occurred during the daytime hours (6 a.m. to 4 p.m.), with the most occurring at 11 a.m.
- Alternatively, the highest collisions per vehicle (those on the road at each hour) occurred in the middle of the night (2 a.m. to 6 a.m.) with 2 a.m. the most likely time for a collision.
According to the data, the study revealed that the majority of collisions occurred during the day when traffic volumes were at their highest. Conversely, per-vehicle collisions were more frequent late at night when visibility was reduced and traffic volumes were lower.
Interestingly, the day of the week also played a role in the likelihood of collisions. In 2022, Tuesdays experienced the highest number of collisions per vehicle, while Saturdays emerged as the safest day with the lowest collision rates. Sundays followed closely behind as the second safest day.
These findings indicate a strong correlation between high levels of weekday commute traffic and an increased likelihood of collisions. This trend was further supported by the lower collision rates observed during weekends.
Most collisions happen in clear weather, often due to animal strikes. The survey showed:
- While 13.1% of collisions occurred during rainy weather, 83.9% occurred in clear conditions, with only 2.9% occurring in snowy weather and 0.1% in foggy conditions.
- Animal strikes accounted for 29.7% of the collisions in clear weather and 9.4% in rainy conditions. In contrast, fixed objects accounted for 11.7% of accidents in clear conditions and 16% in rainy conditions.